
gcp_exporter_config
Overview
The gcp_exporter_config block configures the gcp_exporter integration, which is an embedded version of
stackdriver_exporter
. This allows for the collection of
metrics data from GCP Cloud Monitoring (formerly stackdriver)
. The exporter supports all metrics available via GCP’s monitoring API
.
Metric names follow the template stackdriver_<monitored_resource>_<metric_type_prefix>_<metric_type>.
The following example shows a load balancing metric:
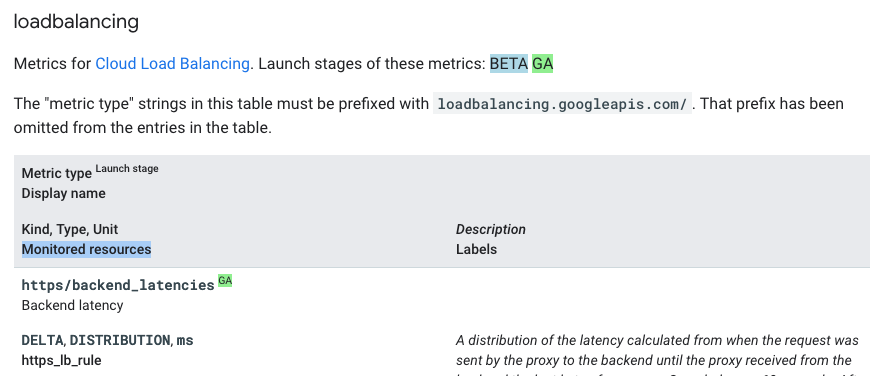
The following list shows its attributes:
monitored_resource = https_lb_rule
metric_type_prefix = loadbalancing.googleapis.com/
metric_type = https/backend_latencies
These attributes result in a final metric name of:
stackdriver_https_lb_rule_loadbalancing_googleapis_com_https_backend_latencies
Authentication
Grafana Agent must be running in an environment with access to the GCP project it is scraping. The exporter uses the Google Golang Client Library, which offers a variety of ways to provide credentials . Choose the option that works best for you.
After deciding how Agent will obtain credentials, ensure the account is set up with the IAM role roles/monitoring.viewer.
Since the exporter gathers all of its data from GCP monitoring APIs
, this is the only permission needed.
Configuration reference
  #
  # Common Integration Settings
  #

  # Enables the gcp_exporter integration, allowing Agent to automatically collect metrics or expose gcp metrics.
  [enabled: <boolean> | default = false]

  # Sets an explicit value for the instance label when the integration is self-scraped. Default is
  # based on subscriptions and ResourceType being monitored.
  [instance: <string>]

  # Automatically collect metrics from this integration. If disabled, the exporter integration is run but not
  # scraped and thus not remote-written. Metrics for the integration are exposed at
  # /integrations/gcp_exporter/metrics and can be scraped by an external process.
  [scrape_integration: <boolean> | default = <integrations_config.scrape_integrations>]

  # How often should the metrics be collected? Defaults to
  # prometheus.global.scrape_interval.
  [scrape_interval: <duration> | default = <global_config.scrape_interval>]

  # The timeout before considering the scrape a failure. Defaults to
  # prometheus.global.scrape_timeout.
  [scrape_timeout: <duration> | default = <global_config.scrape_timeout>]

  # Allows for relabeling labels on the target.
  relabel_configs:
    [- <relabel_config> ... ]

  # Relabel metrics coming from the integration, allowing series that you don't care about to be dropped
  # from the integration.
  metric_relabel_configs:
    [ - <relabel_config> ... ]

  # How frequently to truncate the WAL for this integration.
  [wal_truncate_frequency: <duration> | default = "60m"]

  #
  # Exporter-specific configuration
  #

  # Required: Configure the GCP Project(s) to scrape for metrics.
  project_ids:
    [ - <string> ... ]

  # Required: One or more values from the supported GCP Metrics(https://cloud.google.com/monitoring/api/metrics_gcp).
  # These can be as targeted or loose as needed.
  # Using pubsub metrics (https://cloud.google.com/monitoring/api/metrics_gcp#gcp-pubsub) as an example
  # all metrics.
  #   - pubsub.googleapis.com/
  # all snapshot specific metrics
  #   - pubsub.googleapis.com/snapshot
  # all snapshot specific metrics and a few subscription metrics
  #   - pubsub.googleapis.com/snapshot
  #   - pubsub.googleapis.com/subscription/num_undelivered_messages
  #   - pubsub.googleapis.com/subscription/oldest_unacked_message_age
  metrics_prefixes:
    [ - <string> ... ]

  # Optional: Used to further refine the resources you would like to collect metrics from.
  # The structure for these filters is <targeted_metric_prefix>:<filter_query>.
  # The `targeted_metric_prefix` is used to ensure the filter is only applied to the metric_prefix(es) where it makes sense.
  #   It does not explicitly have to match a value from `metric_prefixes` but the `targeted_metric_prefix` must be at least a
  #   prefix to one or more `metric_prefixes`.
  #   Example:
  #     metrics_prefixes = pubsub.googleapis.com/snapshot, pubsub.googleapis.com/subscription/num_undelivered_messages
  #     targeted_metric_prefix options would be:
  #       pubsub.googleapis.com (apply to all defined prefixes)
  #       pubsub.googleapis.com/snapshot (apply to only snapshot metrics)
  #       pubsub.googleapis.com/subscription (apply to only subscription metrics)
  #       pubsub.googleapis.com/subscription/num_undelivered_messages (apply to only the specific subscription metric)
  # The `filter_query` is applied to a final metrics API query when querying for metric data
  #   You can read more about the metric API filter options in GCPs documentation https://cloud.google.com/monitoring/api/v3/filters.
  #   The final query sent to the metrics API already includes filters for project and metric type. Each applicable `filter_query`
  #   is appended to the query with an AND.
  extra_filters:
    [ - <string> ... ]

  # Optional: The time range used when querying for metrics.
  # Most of the time the default works perfectly fine. Most documented metrics include a comments of the form
  #   `Sampled every X seconds. After sampling, data is not visible for up to Y seconds.`
  #   As long as your `request_interval` is >= `Y` you should have no issues.
  #   Consider using `ingest_delay` if you would like this to be done programmatically or are gathering slower moving metrics.
  [request_interval: <duration> | default = "5m"]

  # Optional: When enabled this automatically adjusts the time range used when querying for metrics backwards based on
  #   the metadata GCP has published for how long the data can take to be ingested. You can see the values for this in
  #   documented metrics as `After sampling, data is not visible for up to Y seconds.`
  # Since GCPs ingestion delay is an "at worst," this is off by default to ensure data is gathered as soon as it's available.
  [ingest_delay:  <boolean> | default = false]

  # Optional: When enabled this offsets the time range used when querying for metrics by a set amount.
  [request_offset: <duration> | default = "0s"]

  # Optional: When enabled drops metrics from attached projects and only fetches metrics from the explicitly configured `project_ids`.
  [drop_delegated_projects:  <boolean> | default = false]

  # Optional: Sets a timeout on the client used to make API calls to GCP. A single scrape can initiate numerous calls to
  #   GCP, so be mindful if you choose to override this value.
  [gcp_client_timeout: <duration> | default = "15s"]
Configuration Examples
The following examples show working configurations. See the Configuration Reference for a full overview of the configuration options and what they do.
Multiple prefixes
  gcp_exporter:
    enabled: true
    project_ids:
      - <project_id>
    metrics_prefixes:
      - run.googleapis.com/
      - cloudfunctions.googleapis.com/
      - compute.googleapis.com/nat
      - logging.googleapis.com/billing
      - logging.googleapis.com/exports
      - serviceruntime.googleapis.com/quota/
      - storage.googleapis.com/
      - pubsub.googleapis.com/subscription
Load balancing with a filter
  gcp_exporter:
    enabled: true
    project_ids:
      - <project_id>
    metrics_prefixes:
      - loadbalancing.googleapis.com
    extra_filters:
      - loadbalancing.googleapis.com:resource.labels.backend_target_name="sample-value"
Subset of load balancing metrics with a filter
  gcp_exporter:
    enabled: true
    project_ids:
      - <project_id>
    metrics_prefixes:
      - loadbalancing.googleapis.com/https/request_bytes_count
      - loadbalancing.googleapis.com/https/total_latencies
    extra_filters:
      - loadbalancing.googleapis.com:resource.labels.backend_target_name="sample-value"
Was this page helpful?
Related resources from Grafana Labs


