

That’s a wrap on Grafana Live London!
Connect with your local Grafana community in London.
Hands-on demos
Try out the LGTM stack at our hands-on demo booths throughout the event
Learn LGTM
Learn all about Grafana Labs’ LGTM stack: Loki for logs, Grafana for dashboards, Tempo for traces, and Mimir for metrics
Example stacks
See example LGTM stacks for everything from observability to IoT business dashboards
Ask the experts
Get your fill of food and answers at our ATE (Ask the Expert) area.
Lessons & tips
Hear lessons learned from a seasoned Grafana user and tips for getting the most out of Grafana 9.0
Zoom fatigue recovery
Start your Zoom fatigue recovery in a friendly environment with a limited time frame and clear exit strategy
Agenda
1:00
Registration, demo booths, Ask the Experts booth open
Check in and check out demos of ways to correlate data from across the observability ecosystem. Plus: one-on-one time with Grafana maintainers and engineers to ask all your burning questions.
1:30
Opening keynote: What’s new at Grafana Labs
Hear from Grafana Labs senior leaders about community-driven Grafana use cases and the latest milestones from Grafana Labs, including the recent Grafana 9.0 release.
2:00
Your Stack for Anything You'll Attack: Zero to Observable in < 30 Minutes
In this session, you will learn how to take a distributed microservice web application from low visibility to observability bliss in less than 30 minutes by leveraging the LGTM (Loki for logs, Grafana for visualization, Tempo for traces, Mimir for metrics) stack on Grafana Cloud. With this centralized observability, you’ll be able to quickly identify and solve problems as well as provide your stakeholders at every level, from developer to senior leadership, a clear view of the application performance, user experience, and KPIs.
2:30
How Grafana Loki can solve your log management challenges
Log volumes are exploding, and many businesses run into challenges with their traditional log management solutions. Operation at scale is complex and expensive, leading to massive hardware footprints and a very busy ops team. Simple to use and cost effective at scale, Grafana Loki was created to tackle these issues. And Loki pairs extremely well with Prometheus (and of course Grafana). In this talk, you will learn why many organizations are adopting Grafana Loki, what distinguishes Loki from traditional solutions, and how easy it is to get started.
3:00
Break - Demo booths, Ask the Experts booth open
Explore hands-on demos of ways to correlate data from across the observability ecosystem. More one-on-one time with Grafana maintainers and engineers to ask all your burning questions.
3:15
Introducing Grafana Incident
Get a first look at Grafana Labs’ latest IRM (Incident Response Management) offering, Grafana Incident. Director of Engineering Mat Ryer will talk about the industry best practices behind the design of the tool and show off the feature set that is already helping teams manage their incidents and improve processes.
3:45
The Paved Road to Observability at a Global Financial Services Leader
London-based IG Group is a global financial services leader in online trading and investments with operations in 20 countries across five continents. They are on a mission to power the pursuit of financial freedom for the ambitious. An integral part of achieving that mission involves streamlining disparate monitoring solutions into a modern, unified observability strategy for maximum impact across the organization.In this session, Technology Architect James Andrews and Logging and Telemetry Team Lead Natalie Ujuk will share how they are moving to an “Observable by Default” state at IG Group by changing mindsets across the company. They’ll share how they are paving the way for full stack observability using a flexible big tent architecture with solid standards upfront and leveraging the Grafana platform as the first pane of glass.
4:15
Drinks, snacks, demos, and Ask the Experts booth
Enjoy a reception with the Grafana team and users like you. Get all your remaining questions answered during continued demos and Ask the Experts booth time.
5:00
Event close
Speakers

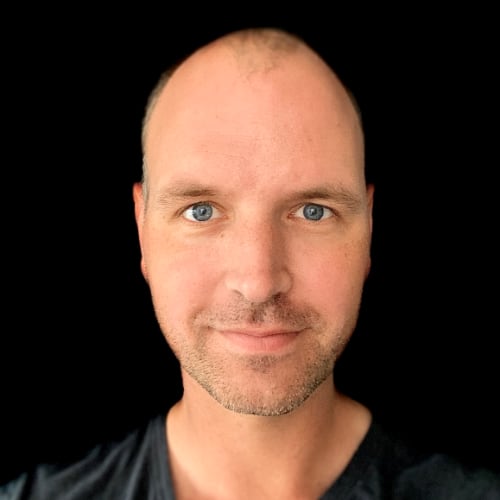
Dave Russell
Grafana Labs
VP, Solutions Engineering

Robin Gustafsson
Grafana Labs
VP of Product
Mat Ryer
Grafana Labs
Principal Software Engineer
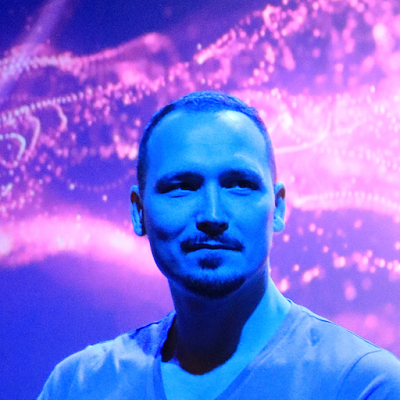
Ward Bekker
Grafana Labs
Senior Principal Solutions Engineer

Natalie Ujuk
IG Group
Logging and Telemetry Team Lead

James Andrews
IG Group
Technology Architect
When:
28 September, 2022
Where
The View in The Royal College of Surgeons of England
Register to attend
Seating is extremely limited, so register now to save your seat.
Registration fees will be donated to Girls Who Code.